| Introduction | Appendix A: Calculating Residual Pool Water Volume, Fine-Sediment Volume, and V* |
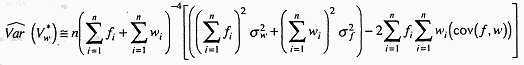
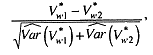
| Applications and Limitations | Appendix B: Estimating the Variance of the Estimate of V* |
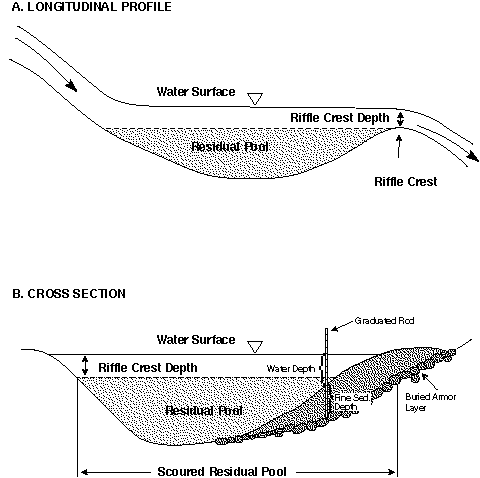
| Methods | Figure 1-A and 1-B: Longitudinal profile and cross section of a pool |
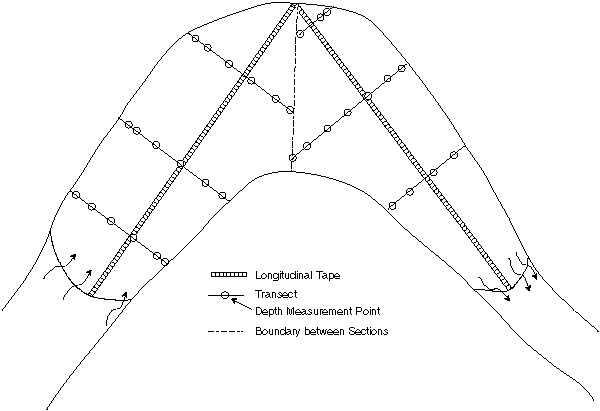
| Accuracy of the Estimates | Figure 2: Pool #21, Horse Linto Creek, showing tape, transects, measurement points for water and fine sediment depth, riffle crest and measurement points... |
| Discussion | Figure 3: Measuring a pool with a bend. |
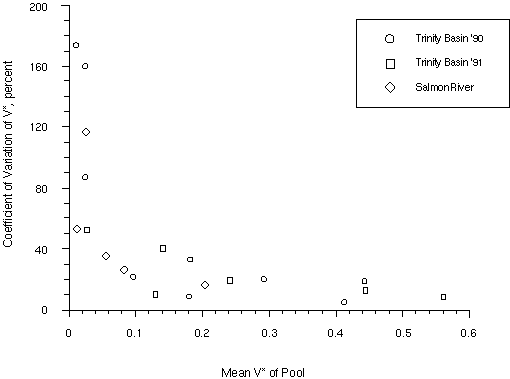
| Summary of Recommendations | Figure 4: Variability of the estimate of V* |
| End Notes and References | Figure 5: Predicted sample sizes necessary to limit error in V*w |
ABSTRACT
The fraction of pool volume filled with fine sediment (usually fine sand to medium gravel) can be a useful index of the sediment supply and substrate habitat of gravel-bed channels. It can be used to evaluate and monitor channel condition and to detect and evaluate sediment sources. This fraction (V*) is the ratio of fine-sediment volume to pool water volume plus fine-sediment volume. These volumes are computed for the residual portion of the pool that lies below the elevation of the downstream riffle crest. Fine-sediment thickness is measured by driving a graduated metal probe into a fine-grained deposit until the underlying coarser substrate is felt. Water depth and fine-sediment thickness are measured across transects, and volumes are computed by summing products of cross-sectional areas and distances between transects. Replicate measurements of V* were made in 20 pools, and the variability of V*w, the weighted mean value of V* for a reach, was analyzed in 12 reaches. The largest source of variability in V* was the measurement of fine sediment volume. Topographic irregularities in pools and on riffle crests and effects of variation in discharge on measurement of riffle crest elevation also affected V*. Ten to 20 pools are needed to estimate V*w in a reach, depending on acceptable error and variability between pools.
Retrieval Terms : fine sediment, pools, monitoring, sedimentation, fish habitat
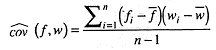
 has a standard normal distribution.